Mapping Bihar’s Demographics: Key Takeaways from the 2023 Caste Census
The Bihar Caste Census, whose findings were released on October 2, 2023, has provided a significant new dataset that is set to profoundly influence the state’s political and social discourse. Conducted after decades, this survey offers a contemporary demographic snapshot of Bihar’s population, challenging previous estimations and fueling demands for revised policies, particularly concerning reservations.
Key Findings and Broad Categories:
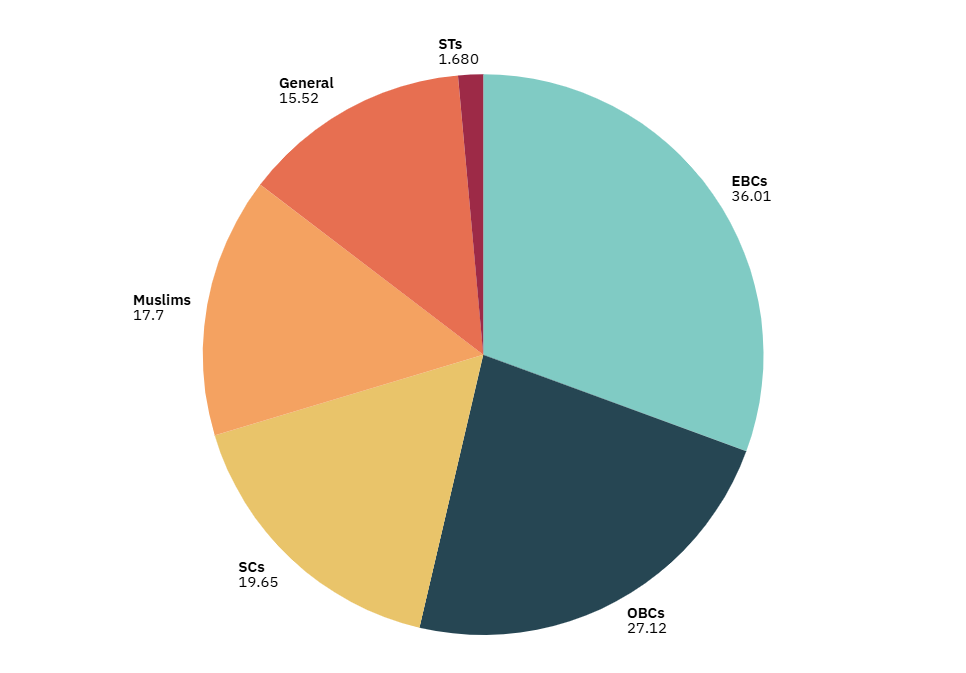
The census revealed a total population of approximately 13.07 crore (130.7 million). The most striking revelation was the numerical dominance of the Extremely Backward Classes (EBCs) and Other Backward Classes (OBCs), who together constitute over 63% of the state’s population.
- Extremely Backward Classes (EBCs): 36.01%
- Other Backward Classes (OBCs): 27.12%
- Scheduled Castes (SCs): 19.65%
- Scheduled Tribes (STs): 1.68%
- General Category (Forward Castes): 15.52%
- Muslims (as a religious minority): 17.70% (distributed across various caste categories, including some OBC/EBC groups like Sheikh, Momin, Surjapuri Muslim, Dhuniya, etc.)
This data has given fresh impetus to the long-standing demand for a re-evaluation of reservation quotas, potentially challenging the 50% ceiling set by the Supreme Court. Political parties within Bihar’s ruling alliance have lauded the survey as a crucial step towards “social justice” and “development with justice,” aiming to tailor welfare schemes more effectively. However, the survey has also faced legal challenges and political scrutiny, with some questioning its methodology and potential implications for social cohesion.
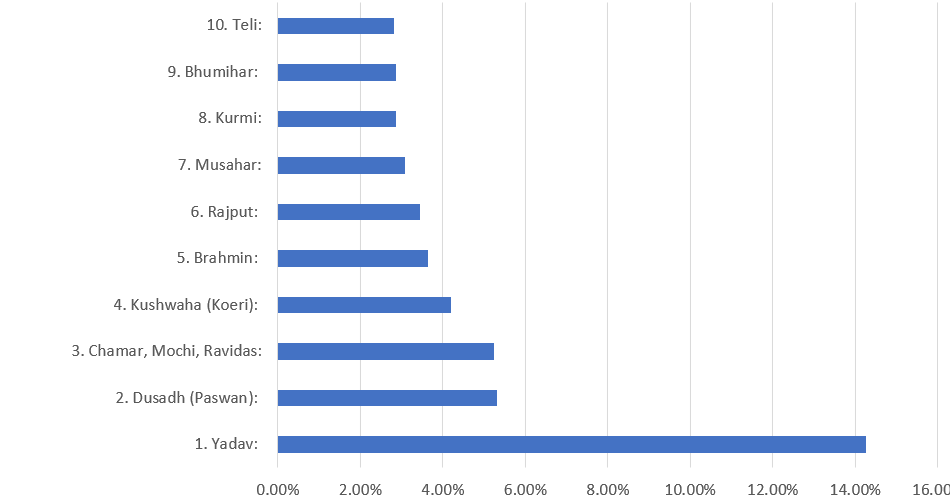
Top 10 Castes by Population in Bihar (2023 Census)
The detailed breakdown of the survey results provides insights into individual caste strengths. Here are the top 10 castes by their percentage share in Bihar’s total population:
- Yadav: 14.26%
- Dusadh (Paswan): 5.31% (Scheduled Caste)
- Chamar, Mochi, Ravidas: 5.25% (Scheduled Caste)
- Kushwaha (Koeri): 4.21%
- Brahmin: 3.65%
- Rajput: 3.45%
- Musahar: 3.08% (Extremely Backward Class)
- Kurmi: 2.87%
- Bhumihar: 2.86%
- Teli: 2.81%
Note: Some lists combine certain sub-castes for simplicity, e.g., Dusadh covers Dhari, Dharhi; Chamar covers Mochi, Ravidas, Charmkar, Rohidas.
Geographical Distribution (High-Level Analysis)
While the full, granular geographical distribution for every sub-caste across all districts is not publicly released in detailed maps, general concentrations of major caste groups in Bihar are widely acknowledged and partially corroborated by the census data:
- Yadavs: Predominantly concentrated in the central and northern plains of Bihar, often with significant presence in districts like Patna, Gaya, Darbhanga, Madhubani, Muzaffarpur, and parts of the Seemanchal region. They hold substantial political influence in these areas.
- Dalits (Scheduled Castes like Dusadh, Chamar/Ravidas, Musahar): Generally spread across the state, but often form significant proportions in rural pockets and economically disadvantaged regions. Musahars, for instance, are known to be highly marginalized and often concentrated in specific villages or hamlets, particularly in south-central Bihar.
- Kushwahas (Koeris) & Kurmis: These OBC groups have notable presence in central Bihar, including districts like Nalanda, Patna, and Rohtas, often associated with agricultural prosperity.
- Upper Castes (Brahmin, Rajput, Bhumihar): While numerically smaller, these groups have historically held significant landownership and influence. Brahmins are found across the state but might have concentrations in traditional cultural centers. Rajputs have strongholds in western and central Bihar, including Bhojpur and Rohtas. Bhumihars are traditionally concentrated in districts like Begusarai, Monghyr, and parts of Patna.
- Muslims: Significant concentrations are found in the Seemanchal region (Kishanganj, Araria, Purnea, Katihar districts) in eastern Bihar, as well as parts of northern Bihar (e.g., Darbhanga, Sitamarhi).
The caste census has not only provided numbers but also socio-economic indicators, revealing significant disparities in poverty, education, and government job participation across various caste groups. For instance, SCs, STs, and EBCs generally show higher poverty rates compared to OBCs and General categories.